Week2 : Simple AJA JSON system to visualise the result of simulation
Hi all!
Firstly I will explain what I did this week and discussion of this.
And then I will confirm the task of next week.
1. What I did this week
1.1 Implementation : AJA JSON system to visualise the result of simulation
Last week I concentrated on the implementation of AJAX. However, this is a little bit complicated because client side JavaScript should analyse the XML data from server side. Therefore, I changed the server side code to send the result as JSON format. Manipulating the JSON data in Java code, I used the library of JSONIC(Jsonic ver1.3.10 and this is added in pom.xml of my project).
Following my proposal, I planned to implement simple visualisation of analysis result. Therefore, I implemented client side visualisation system with AJA JSON.
Following figure showed overview of my implementation and this has been already committed to GitHub repository and you can check that.


[ Discussion ]
Current implementation is really simple but basic approach to visualise the result. Following tasks are convenient for users and these can be implemented by the way of preparing call back function and sending the result by JSON from server side.
(1) Selecting the library to analyse( current implementation : COPASI , future implementation : SimulationCore and libRoadRunner)
(2) Selecting initial value and parameters of simulation ( At this time I will use JSBML library to edit the model in servlet code)
(3) Set the graph parameter automatically at first and then let user select these parameters( such as max number of x-axis, the interval of x-axis, the colour of each line)
1.2 Survey : The mathematical algorithm and license of each library
In my project I will implement the analysis of simulation, steady state analysis and parameter estimation. Until now I only used COPASI, but this is too poor for users to analyse and it is significant to implement the analysis with libraries which are mathematically different from COPASI. This approach enable users to choose best algorithm to analyse their model.
My mentor , Dr. Draeger and Kaito showed me many libraries and I surveyed the aspect of mathematics in these libraries. The result is shown below.

Table1.2.1 shows that these libraries are mathematically different from each other. Therefore, I will use these libraries after I implement the application only with COPASI.
2. The task of next week following proposal
Next week I will implement the simple implementation of parameter estimation both for client side HTML and server side servlet.
Thank you!
Reference :
[1] Hoops, Stefan, et al. ”COPASI―a complex pathway simulator.” Bioinformatics 22.24 (2006): 3067-3074.
[2] Keller, Roland, et al. ”The systems biology simulation core algorithm.” BMC systems biology 7.1 (2013): 55.
[3] Somogyi, Endre T., et al. ”libRoadRunner: a high performance SBML simulation and analysis library.” Bioinformatics (2015): btv363.
Firstly I will explain what I did this week and discussion of this.
And then I will confirm the task of next week.
1. What I did this week
1.1 Implementation : AJA JSON system to visualise the result of simulation
Last week I concentrated on the implementation of AJAX. However, this is a little bit complicated because client side JavaScript should analyse the XML data from server side. Therefore, I changed the server side code to send the result as JSON format. Manipulating the JSON data in Java code, I used the library of JSONIC(Jsonic ver1.3.10 and this is added in pom.xml of my project).
Following my proposal, I planned to implement simple visualisation of analysis result. Therefore, I implemented client side visualisation system with AJA JSON.
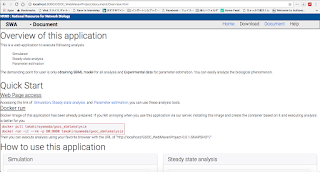
Following figure showed overview of my implementation and this has been already committed to GitHub repository and you can check that.

Fig 1.1.1 : Client side html of simulation analysis

Fig 1.1.2 : Choosing the model, the simulation result is visualized as the figure whose horizontal axis refers to time and vertical axis refers to concentration of each species

Fig 1.1.3 : If the other model is selected, then dynamically the result is visualized.
[ Discussion ]
Current implementation is really simple but basic approach to visualise the result. Following tasks are convenient for users and these can be implemented by the way of preparing call back function and sending the result by JSON from server side.
(1) Selecting the library to analyse( current implementation : COPASI , future implementation : SimulationCore and libRoadRunner)
(2) Selecting initial value and parameters of simulation ( At this time I will use JSBML library to edit the model in servlet code)
(3) Set the graph parameter automatically at first and then let user select these parameters( such as max number of x-axis, the interval of x-axis, the colour of each line)
1.2 Survey : The mathematical algorithm and license of each library
In my project I will implement the analysis of simulation, steady state analysis and parameter estimation. Until now I only used COPASI, but this is too poor for users to analyse and it is significant to implement the analysis with libraries which are mathematically different from COPASI. This approach enable users to choose best algorithm to analyse their model.
My mentor , Dr. Draeger and Kaito showed me many libraries and I surveyed the aspect of mathematics in these libraries. The result is shown below.
Table 1.2.1 : The libraries for simulation , steady state analysis and parameter estimation. This table shows the solver, API, License and possibility of distribution(considering the future work of Docker image distribution) for each libraries.

Table1.2.1 shows that these libraries are mathematically different from each other. Therefore, I will use these libraries after I implement the application only with COPASI.
2. The task of next week following proposal
Next week I will implement the simple implementation of parameter estimation both for client side HTML and server side servlet.
Thank you!
Reference :
[1] Hoops, Stefan, et al. ”COPASI―a complex pathway simulator.” Bioinformatics 22.24 (2006): 3067-3074.
[2] Keller, Roland, et al. ”The systems biology simulation core algorithm.” BMC systems biology 7.1 (2013): 55.
[3] Somogyi, Endre T., et al. ”libRoadRunner: a high performance SBML simulation and analysis library.” Bioinformatics (2015): btv363.


コメント
コメントを投稿