投稿

7月, 2017の投稿を表示しています

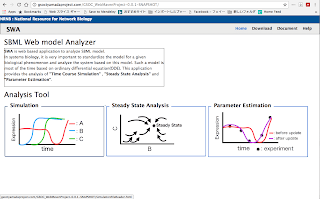
Week11 : design of html for steady state analysis and parameter estimation and many minor implementation

イメージ
Hi All 1 What I did this week 1.1 Minor implementation discussed last meeting I finished following implementation. 1. Adding the algorithm of differential evolution and particle swarm optimisation and eliminating genetic algorithm for parameter estimation analysis tool 2. Changing the identifier of species, compartment and kinetic parameter in client side UI to name attribute of SBML if it is defined for all analysis tool 3. Adding the units of species, kinetic parameter to table in client side UI 4. Changing the chart object in client side UI to singleton. This enables graph not to change suddenly 5. Elaborating the UI of parameter selection.    5-1 If no parameter exists, the tab will be disabled to select    5-2 If no parameter exists in initialAmount, selected tab is automatically changed to the tab    obtaining some parameters    5-3 Adding the tab to change the compartment size    5-4 Grouping species, compartment and kinetic parameter. Global parameter and local pa

Week10 : Designing of html using css and bootstrap library

イメージ
Hi all 1. What I did this week 1.1 The minor implementation discussed last week. I finished following implementation discussed last week. 1. Adding Run button 2. Setting the form to change x axis to logarithmic scale 3. Setting visualized expression of each species to same result between COASI and simulationCore 5. Pop-uping the species ID when user hovers the mouse over the plot of expression 6. Setting the form to change the tolerance in simulation Regarding "4. Grouping species, parameters and compartments in UI of changing these values" , I try to implementation from tomorrow. 1.2 Designing of top-page and simulation html I used bootstrap to design html. This design can change responsively when the browser is changed or the space of canvas is changed. 1.3 Demo of design Fig 1.3.1 Design of top page Fig 1.3.2 Design of simulation page Fig1.3.3 Design of simulation canvas and parameter change widget [Discussion] 1) Current design The

Week9 : Numerical table of the result from simulation and parameter estimation

イメージ
Hi all 1. What I did this week I focused on the implementation of numerical table in the result of simulation and parameter estimation. 1.1 Demo of numerical table in simulation Fig1.1.1 : The table of simulation result is visualized. Each row refers to time and column refers to the species.  1.2 Demo of numerical table in parameter estimation Fig1.2.1 : The table of parameter estimation result is visualized. First column refers to the reaction ID and second column refers to the parameter ID. Third and Forth column refer to the start value of this parameter and fitted parameter respectively. [Discussion] 1) The implementation of the table I finished this implementation of table. Following table shows my current progress. Table 1 : Current implementation of visualisation UI : ○ means this is already finished and × means vice versa. Visualization UI Graphical Numerical Simulation ○ ○ Steady State Analysis × ○ Parameter

Week8 : Test execution of simulation for large model : red blood cell model

イメージ
Hi all 1. What I did this week I mainly focused on the test of simulation execution for large model: red blood cell model[1]. I tried to execute simulation. 1.1 Demo of simulation for red blood cell model Fig1.1.1 : Demo of simulation for red blood cell model As you can see, the dynamic range of the expression for these species are wide. Therefore, the result is really difficult to see. So I tried to set the form to change it logarithmic scale. Fig1.1.2 : The logarithmic scale to visualize the simulation for red blood cell model. This implementation is also difficult to see. I will discuss it in [Discussion]. Moreover, I faced the other problem to scale logarithmic Fig1.1.3 : If the end time is changed to more than 60 for red blood cell model, the logarithmic scaling is crushed. This is specifically happened in the condition following Fig.1.1.3. I have already confirmed that logarithmic scaling is correctly worked for other models in almost all of simula