Week11 : design of html for steady state analysis and parameter estimation and many minor implementation
Hi All
1 What I did this week
1.1 Minor implementation discussed last meeting
I finished following implementation.
1. Adding the algorithm of differential evolution and particle swarm optimisation and eliminating genetic algorithm for parameter estimation analysis tool
2. Changing the identifier of species, compartment and kinetic parameter in client side UI to name attribute of SBML if it is defined for all analysis tool
3. Adding the units of species, kinetic parameter to table in client side UI
4. Changing the chart object in client side UI to singleton. This enables graph not to change suddenly
5. Elaborating the UI of parameter selection.
5-1 If no parameter exists, the tab will be disabled to select
5-2 If no parameter exists in initialAmount, selected tab is automatically changed to the tab obtaining some parameters
5-3 Adding the tab to change the compartment size
5-4 Grouping species, compartment and kinetic parameter. Global parameter and local parameter belongs to kinetic parameter. Local parameter is grouped based on the reaction belonging to.
1.2 Design of html for steady state analysis and parameter estimation. In addition, elaborating the design of index.html and simulationFileReader.html
I used bootstrap to design html like last week. This week I mainly focus on studying the grid system to distribute html object.
1.3 Test the execution of simulation and steady state analysis for the SBML Test Suite(http://sbml.org/Software/SBML_Test_Suite) model
My mentor, Andreas, pointed out no result is visualized when the No.786 model of SBML Test Suite is analysed using my application. I will fix some bug and visualized result of this execution finally.
1.4 Demo of design


I will implement docker image next month. I'm totally newcomer of this system and I will learn this week.
2) Add download button of result for these analysis
3) Add the system to change the upper bound and lower bound of parameter for parameter estimation.
Thank you!
1 What I did this week
1.1 Minor implementation discussed last meeting
I finished following implementation.
1. Adding the algorithm of differential evolution and particle swarm optimisation and eliminating genetic algorithm for parameter estimation analysis tool
2. Changing the identifier of species, compartment and kinetic parameter in client side UI to name attribute of SBML if it is defined for all analysis tool
3. Adding the units of species, kinetic parameter to table in client side UI
4. Changing the chart object in client side UI to singleton. This enables graph not to change suddenly
5. Elaborating the UI of parameter selection.
5-1 If no parameter exists, the tab will be disabled to select
5-2 If no parameter exists in initialAmount, selected tab is automatically changed to the tab obtaining some parameters
5-3 Adding the tab to change the compartment size
5-4 Grouping species, compartment and kinetic parameter. Global parameter and local parameter belongs to kinetic parameter. Local parameter is grouped based on the reaction belonging to.
1.2 Design of html for steady state analysis and parameter estimation. In addition, elaborating the design of index.html and simulationFileReader.html
I used bootstrap to design html like last week. This week I mainly focus on studying the grid system to distribute html object.
1.3 Test the execution of simulation and steady state analysis for the SBML Test Suite(http://sbml.org/Software/SBML_Test_Suite) model
My mentor, Andreas, pointed out no result is visualized when the No.786 model of SBML Test Suite is analysed using my application. I will fix some bug and visualized result of this execution finally.
1.4 Demo of design

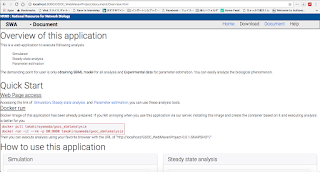
Fig 1.4.1 : Elaborated design of index.html

Fig 1.4.2 : If you hover the mouse on analysis tool, the animation is triggered and user can easily feel it can be selected.

Fig 1.4.3 Elaborated design of simulationFileReader.html

Fig 1.4.4 If there is no parameters( Global parameter for instance), the parameter selection tab is disabled

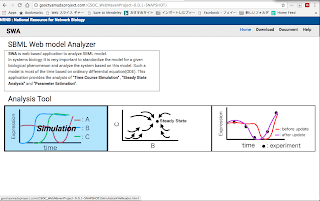
Fig 1.4.5 : Design of steady state analysis

Fig 1.4.6 : Design of parameter estimation
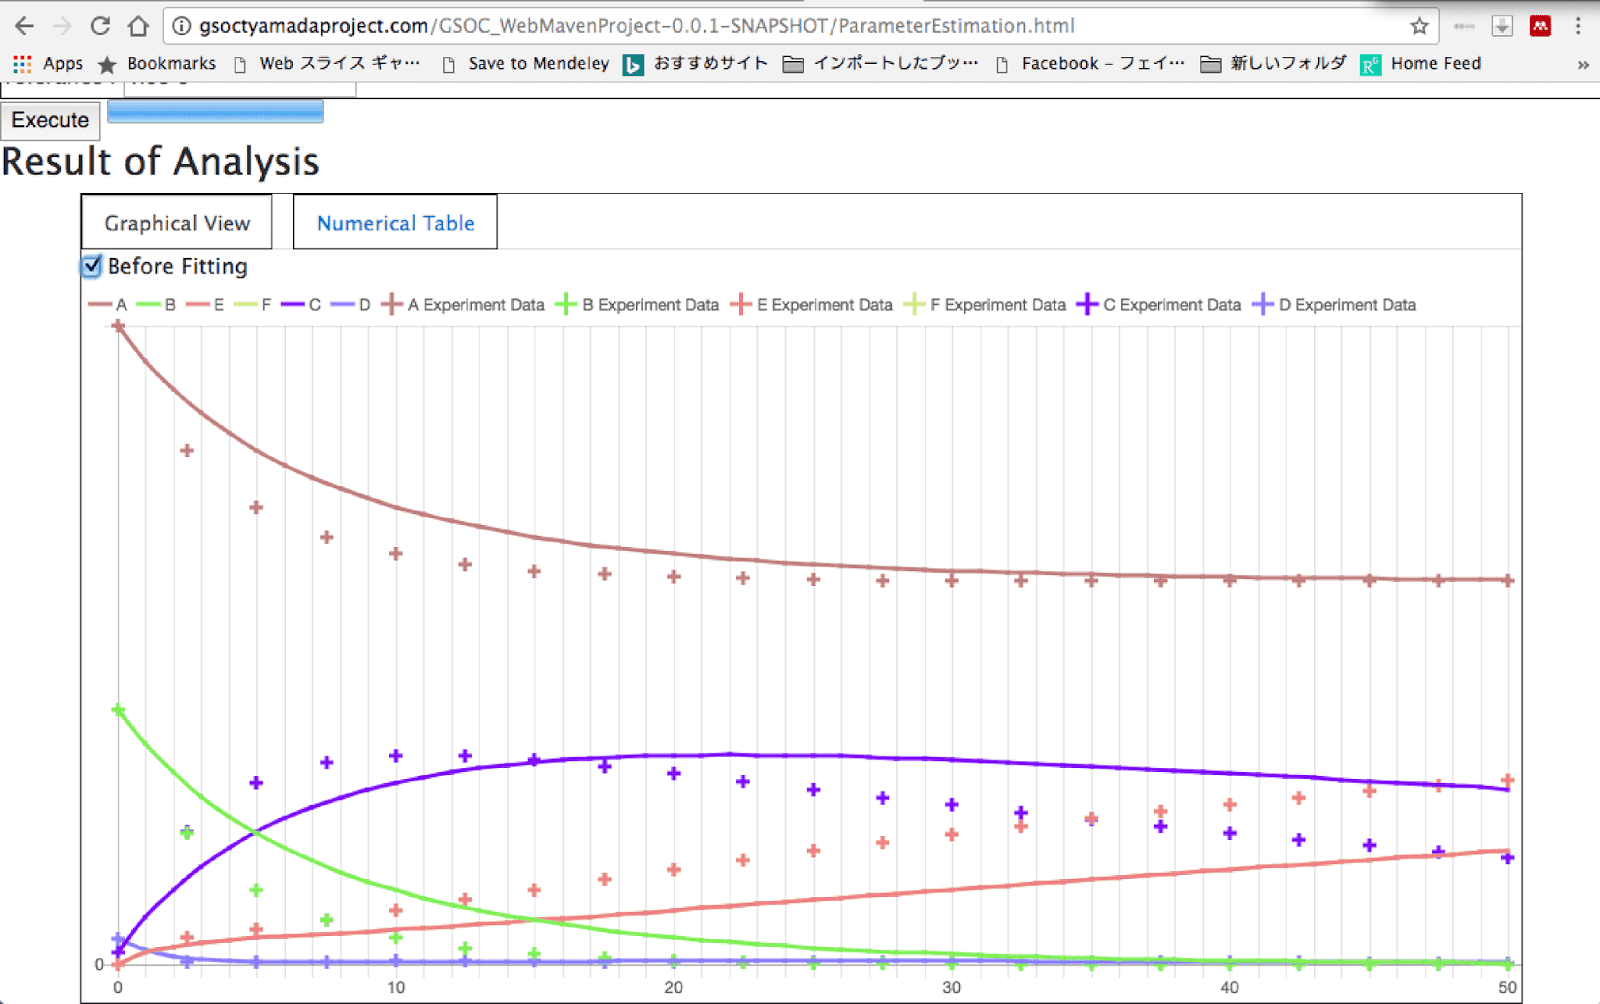
Fig 1.4.7 : If user select the check box of "before fitting" , the result of before fitting is visualized. Then user can understand the parameter estimation correctly worked.

Fig 1.4.8 : Table of fitted parameter

Fig 1.4.9 : The execution of simulation for No.786 model of SBML Test Suite, graphical view is correctly visualised

Fig 1.4.10 : The execution of simulation for No.786 model of SBML Test Suite , numerical table is correctly visualized

Fig 1.4.11 : The execution of steady state analysis for No.786 model of SBML Test Suite, species information is correctly visualised

Fig 1.4.11 : The execution of steady state analysis for No.786 model of SBML Test Suite, Jacobian matrix is correctly visualised
[Discussion]
1. Designing
This week I finished to elaborate the design of index.html and simulationFileReader.html using grid system which means the responsive design was accomplished and MDB( Material Designing for Bootstrap : https://github.com/mdbootstrap/bootstrap-material-design) which means the interactive design was achieved. I will take these technique to the html of steady state analysis and parameter estimation.
2. Automatic test system
This week I tried to test the execution of simulation and steady state analysis only for No.786 model of SBML Test Suite. However, there are not only this model but also many models in SBML Test Suite. This means manual test is difficult for me to check. Therefore, I will create the system to test automatically. Now I planned to use Jenkins(https://jenkins.io) and Selenium(http://www.seleniumhq.org) which is suggested by my mentor, Kaito, to create automatic test system.
2. The task of next week
1) Learning Docker systemI will implement docker image next month. I'm totally newcomer of this system and I will learn this week.
2) Add download button of result for these analysis
3) Add the system to change the upper bound and lower bound of parameter for parameter estimation.
Thank you!

コメント
コメントを投稿