Week10 : Designing of html using css and bootstrap library
Hi all
1. What I did this week
1.1 The minor implementation discussed last week.
I finished following implementation discussed last week.
1. Adding Run button
1. What I did this week
1.1 The minor implementation discussed last week.
I finished following implementation discussed last week.
1. Adding Run button
2. Setting the form to change x axis to logarithmic scale
3. Setting visualized expression of each species to same result between COASI and simulationCore
5. Pop-uping the species ID when user hovers the mouse over the plot of expression
6. Setting the form to change the tolerance in simulation
Regarding "4. Grouping species, parameters and compartments in UI of changing these values" , I try to implementation from tomorrow.
1.2 Designing of top-page and simulation html
I used bootstrap to design html. This design can change responsively when the browser is changed or the space of canvas is changed.
1.3 Demo of design


[Discussion]
1) Current design
The banner of this design is provisional. Therefore, I should discuss it with my mentor and change it based on it. In terms of the canvas and parameter change widget in simulation, I believed that this is totally easy for user to change value and get result.
2) Future implementation discussed last week
We discussed following implementation is significant for user-friendly application.
1. Changing the SBML ID used as identifier in canvas and table etc to name attribute in SBML model if the name is defined.
2. Adding the units of value in table
3. Adding the multi row of table to show the local parameters grouped based on reaction in parameter estimation
2. The task of next week
I will implement the contents of last week's discussion and 2) of [Discussion] firstly. Then, I will design the UI of html for steady state analysis and parameter estimation.
Thank you!
Regarding "4. Grouping species, parameters and compartments in UI of changing these values" , I try to implementation from tomorrow.
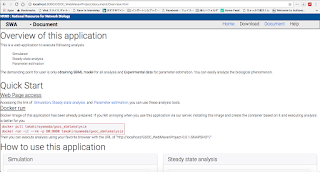
1.2 Designing of top-page and simulation html
I used bootstrap to design html. This design can change responsively when the browser is changed or the space of canvas is changed.
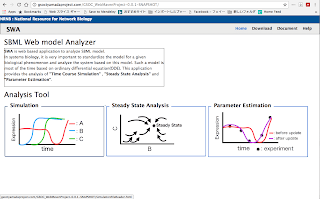
1.3 Demo of design

Fig 1.3.1 Design of top page

Fig 1.3.2 Design of simulation page

Fig1.3.3 Design of simulation canvas and parameter change widget
[Discussion]
1) Current design
The banner of this design is provisional. Therefore, I should discuss it with my mentor and change it based on it. In terms of the canvas and parameter change widget in simulation, I believed that this is totally easy for user to change value and get result.
2) Future implementation discussed last week
We discussed following implementation is significant for user-friendly application.
1. Changing the SBML ID used as identifier in canvas and table etc to name attribute in SBML model if the name is defined.
2. Adding the units of value in table
3. Adding the multi row of table to show the local parameters grouped based on reaction in parameter estimation
2. The task of next week
I will implement the contents of last week's discussion and 2) of [Discussion] firstly. Then, I will design the UI of html for steady state analysis and parameter estimation.
Thank you!


コメント
コメントを投稿