投稿

Final Week : Create document and implement some minor UI

イメージ
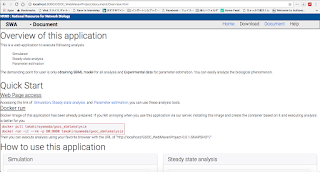
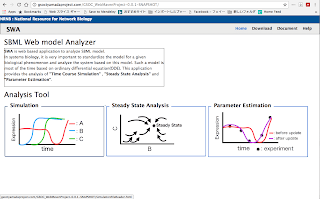
Hi all 1. What I did this week I created document and implement some minor UI this week. 1.1 Document I created document. This document contains "Overview of this application", "Quick Start" and "How to use this application. "How to use this application" contains the document of simulation, steady state analysis and parameter estimation. These documents are basically constructed with the detail sentence and image of this application. In these document, user can change it using pagination. Fig 1.1.1 : Overview of this document Fig 1.1.2 : Simulation document with pagination( Previous and Next) 1.2 Some minor implementation I implemented following minor UI. These are advised by my mentor. 1) Just after pressing confirm button in error message, target form is focused on. 2) Input file with ".xml" and ".sbml" ( both upper and lower case) is acceptable. 3) If the file is not readable, the error message happens( See ...

Week14 : Pop-upping warning and error message

イメージ
Hi all. 1. What I did this week 1.1 Pop-upping error text in client side I used bootstrap modal system to pop-up error text in client side. The error message is popping following situation. 1) The file is not selected 2) The value of some parameters are negative 3) SBML model is invalid. 1.2 Pop-upping warning text in client side I used bootstrap modal system to pop-up warning text in client side. The warning message is popping following situation. 1)  SBML model has some incorrectness( by checking using the method "checkConsistency" of JSBML class SBML_Validator). 1.3 Demo of this implementation Fig1.3.1 : The error message with that file is not selected. Fig1.3.2 : The error message with that the parameter value is negative Fig1.3.3 : The error message with that SBML model is invalid Fig 1.3.4 : The waning message with the SBML has some incorrectness  [Discussion] The warning message is now used by output of SBML_Validater's return v...

Week13 : Creating Docker image , setting the form to change the upper and lower bound for kinetic parameters in parameter estimation and fixing some bugs

イメージ
Hi all 1. What I did this week 1.1 Creating Docker image I focused on creating Docker image this week. Docker image removes the connecting time to the server because the server in container of Docker is created in local environment. In addition, users are not worried about own model leak to the other. 1.2 Setting the form to change the upper and lower bound for kinetic parameters in parameter estimation. My last implementation fixed the lower and upper bound of each kinetic parameter in parameter estimation. However, users sometimes want to change these value because the sensitivity of executing parameter estimation for each kinetic parameter is sometimes different. I tried local and global parameters in SBML model can be changed in my implementation. 1.3 Fixing some bugs My mentors pointed out following bugs last week. 1) Not visualizing the result of analysis using Safari and FireFox( by Andreas) 2) Analysis activated even when the execution button is not clicked (by Andr...

Week12 : Download widget was created and all javascript code to execute ajax transfer is changed based on JQuery

イメージ
Hi all. 1. What I did this week 1.1 Minor implementation Firstly I changed my Javascript code to execute ajax transfer based on JQuery. This change let me to maintain these system easily. 1.2 Major implementation : Download widget to get the result of each analysis I created this widget to get the result of each analysis as png format for graphical result and csv format for table result. This implementation is significantly important for users to get actual result and download it in their local environment. 1.3 Demo of major implementation( Example is Simulation's one) Fig1.3.1 : The download tab is added in the "Result of Analysis" Fig1.3.2 : After user finishes the analysis and click download tab, download dialog open. The file is zip including all the result of analysis. the result of each analysis is png format for graphical result and csv format for table result.  Fig1.3.3 : The result gotten as png format( graphical result). Fig1.3.4 : ...

Week11 : design of html for steady state analysis and parameter estimation and many minor implementation

イメージ
Hi All 1 What I did this week 1.1 Minor implementation discussed last meeting I finished following implementation. 1. Adding the algorithm of differential evolution and particle swarm optimisation and eliminating genetic algorithm for parameter estimation analysis tool 2. Changing the identifier of species, compartment and kinetic parameter in client side UI to name attribute of SBML if it is defined for all analysis tool 3. Adding the units of species, kinetic parameter to table in client side UI 4. Changing the chart object in client side UI to singleton. This enables graph not to change suddenly 5. Elaborating the UI of parameter selection.    5-1 If no parameter exists, the tab will be disabled to select    5-2 If no parameter exists in initialAmount, selected tab is automatically changed to the tab    obtaining some parameters    5-3 Adding the tab to change the compartment size    5-4 Grouping species, compartment and...

Week10 : Designing of html using css and bootstrap library

イメージ
Hi all 1. What I did this week 1.1 The minor implementation discussed last week. I finished following implementation discussed last week. 1. Adding Run button 2. Setting the form to change x axis to logarithmic scale 3. Setting visualized expression of each species to same result between COASI and simulationCore 5. Pop-uping the species ID when user hovers the mouse over the plot of expression 6. Setting the form to change the tolerance in simulation Regarding "4. Grouping species, parameters and compartments in UI of changing these values" , I try to implementation from tomorrow. 1.2 Designing of top-page and simulation html I used bootstrap to design html. This design can change responsively when the browser is changed or the space of canvas is changed. 1.3 Demo of design Fig 1.3.1 Design of top page Fig 1.3.2 Design of simulation page Fig1.3.3 Design of simulation canvas and parameter change widget [Discussion] 1) Current design The ...

Week9 : Numerical table of the result from simulation and parameter estimation

イメージ
Hi all 1. What I did this week I focused on the implementation of numerical table in the result of simulation and parameter estimation. 1.1 Demo of numerical table in simulation Fig1.1.1 : The table of simulation result is visualized. Each row refers to time and column refers to the species.  1.2 Demo of numerical table in parameter estimation Fig1.2.1 : The table of parameter estimation result is visualized. First column refers to the reaction ID and second column refers to the parameter ID. Third and Forth column refer to the start value of this parameter and fitted parameter respectively. [Discussion] 1) The implementation of the table I finished this implementation of table. Following table shows my current progress. Table 1 : Current implementation of visualisation UI : ○ means this is already finished and × means vice versa. Visualization UI Graphical Numerical Simulation ○ ○ Steady State Analysis × ○ Param...

Week8 : Test execution of simulation for large model : red blood cell model

イメージ
Hi all 1. What I did this week I mainly focused on the test of simulation execution for large model: red blood cell model[1]. I tried to execute simulation. 1.1 Demo of simulation for red blood cell model Fig1.1.1 : Demo of simulation for red blood cell model As you can see, the dynamic range of the expression for these species are wide. Therefore, the result is really difficult to see. So I tried to set the form to change it logarithmic scale. Fig1.1.2 : The logarithmic scale to visualize the simulation for red blood cell model. This implementation is also difficult to see. I will discuss it in [Discussion]. Moreover, I faced the other problem to scale logarithmic Fig1.1.3 : If the end time is changed to more than 60 for red blood cell model, the logarithmic scaling is crushed. This is specifically happened in the condition following Fig.1.1.3. I have already confirmed that logarithmic scaling is correctly worked for other models in almost all of simula...

Week7 : Implementation of changing the initial value and parameters value in SBML model to execute simulation

イメージ
Hi all 1. What I did this week I finished to implement the client side UI to change the initial value and parameter value in SBML model and server side program to execute simulation based on this change. I tried to change the html dynamically after SBML model is uploaded to server. 1.1 Demo of this implementation Fig 1.1.1 : Each tab will contain the initial value , local and global parameter in SBML model Fig 1.1.2 : After SBML model is selected, each parameter and this value are visualized. The value can be changed sliding the bar or changing the value of text box. Fig1.1.3 Other initial value changing widget. Fig1.1.4 After changing the initial value( example shows changing initial value of S1 from 0.5 to 0.05), simulation is executed and visualized. Fig1.1.5 If pushing tab of local or global parameter, you can also change these values. [Discussion] Current implementation is pretty annoying to scroll the tab. After scrolling it, simulation result ...

Week6 : Implementation of simulation program by SBSCL , corresponding to the model including the species in listOfParameters and visualization of steady state analysis

イメージ
Hi all. 1. What I did this week I finished following tasks. 1) Implementation of simulation program by SBSCL This can let user get the option to execute simulation because the algorithm of numerical integration by SBSCL is different from COPASI. 2) Corresponding to SBML model including the Species in listOfParameters I assumed all species are included in listOfSpecies last week. However, my mentor, Matthias Koenig, advised me that some models( such as the models for Flux Balance Analysis) include the species in listOfParameters. This week I finished the implementation of simulation and parameter estimation by COPASI corresponding to such models. 3) Visualization of steady state analysis My last implementation in steady state analysis is only to open the download dialog for the result of steady state analysis. This was insufficient for users to catch the result easily. Therefore, I implement the visualization program to show the results based on COPASI UI's implementation...

Week5 : The test server configuration

イメージ
Hi all! 1. What I did this week I mainly focused on creating test server this week. Using the server of a2hosting( https://www.a2hosting.com ) I created the server and configure the environment of this( ex : Installation of tomcat and Java8 , deploying war to tomcat etc). 1.1 Configuration of test server I created the server using a2hosting. The IP address and host name is following. IP : 162.249.4.254 Host name :  gsoctyamadaproject.com In this server, I installed Java8( http://download.oracle.com/otn-pub/java/jdk/8u131-b11/d54c1d3a095b4ff2b6607d096fa80163/jdk-8u131-linux-x64.rpm ) and Tomcat6( http://ftp.riken.jp/net/apache/tomcat/tomcat-6/v6.0.53/bin/apache-tomcat-6.0.53.tar.gz ). After that I configured some environment variables( such as JAVA_HOME and CATALINA_HOME etc). Then I send the war file of my project to this server and deployed it. Then I checked deployed URL can be connected. Fig 1.1.1 : Checking of connection to my server. Red rectangle shows that the...